
Features
On 06, Mar 2013 | In Services | By
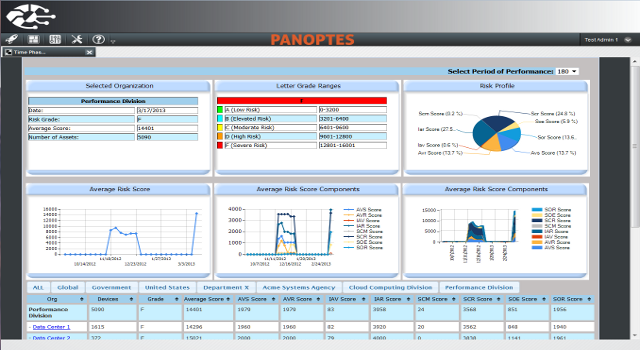
Rich Dashboard Visualizations
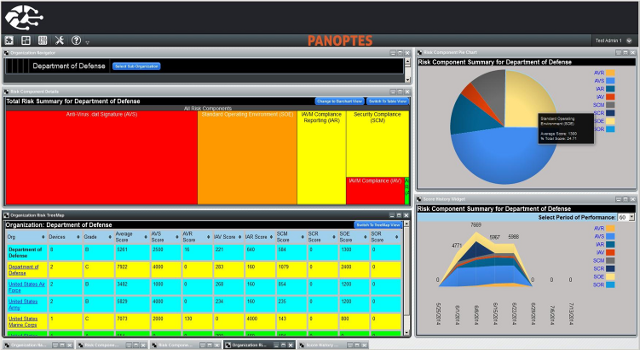
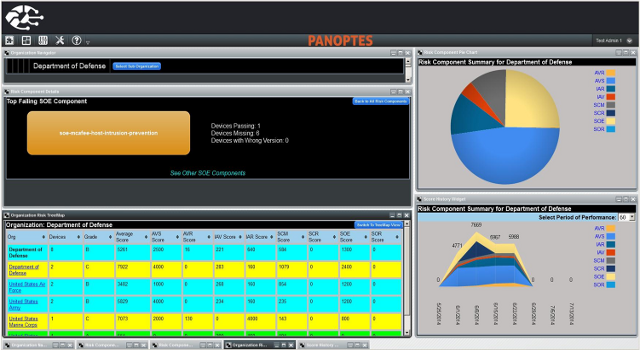
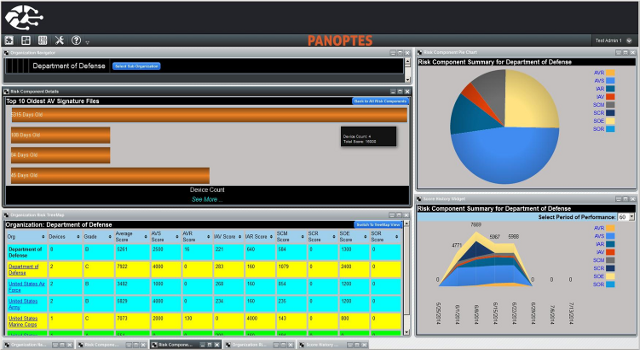
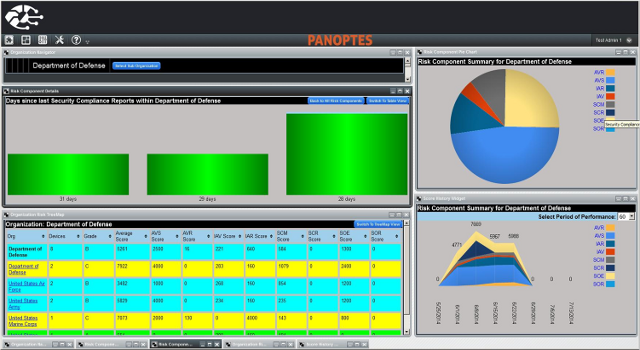
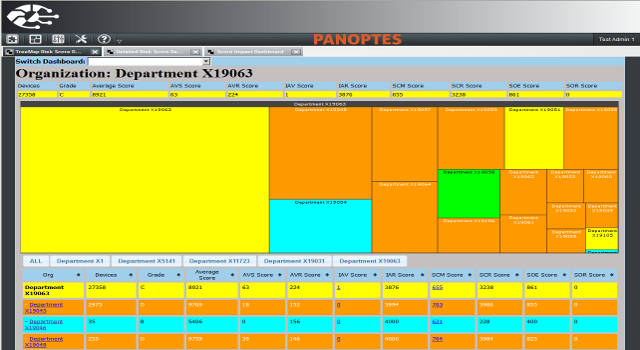
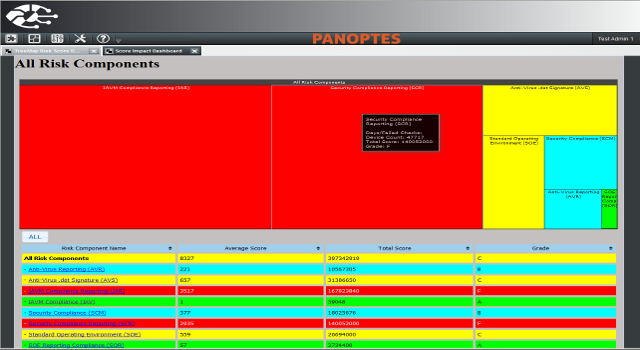
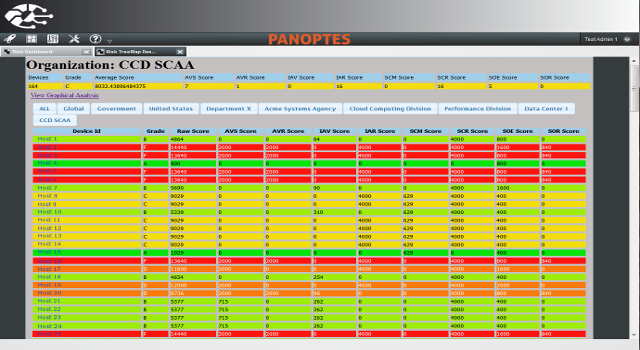
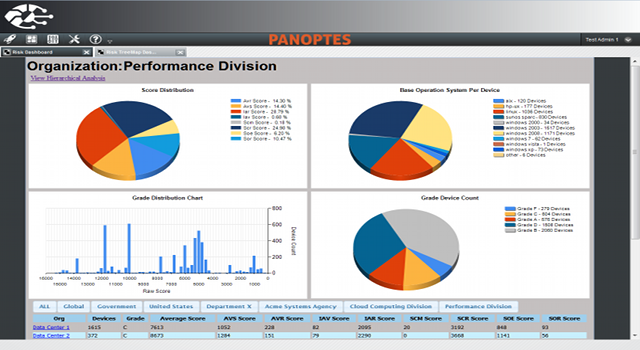
Enterprise Risk Scoring Dashboard
Displays “at-a-glance”, summary, detailed, and time-phased enterprise risk scores to identify systemic issues, analyze trouble spots, and pinpoint specific areas for corrective actions.
Vulnerability Management Dashboard
Assess exposure to vulnerabilities across the enterprise; identify affected and fixed assets; rollup and drilldown results along organizational hierarchies
Benchmark Compliance Dashboard
Query and display benchmark compliance results; filter and group by multiple operational attributes on the devices; rollup and drilldown along multiple hierarchies; pinpoint individual problem devices
Software Inventory Dashboard
Query and display software inventory deployed across the enterprise; filter and group by multiple operational attributes and specific software; rollup and drilldown along multiple hierarchies; drilldown into individual devices
Hardware Inventory Dashboard
Query and display hardware inventory deployed across the enterprise; filter and group by multiple operational attributes on the devices; rollup and drilldown along multiple hierarchies; drilldown into individual devices
Custom Reports
Canned reports to address targeted use cases for specific users; new reports can be quickly developed using the built-in reporting engine